What is Data Docs?
Data docs is a video platform that allows filmmakers and journalist to combine elements from the web, such as interactive graphics, text and scraped information, with linear media, such as video and audio.
Having worked in video both in long-form documentary and web video, we understand the power of visual media. Videos are powerful vehicles that we can use to tell personable or explanatory immersive stories. But one of the drawbacks of video as a medium is that they are finished products, which, after they have been published, become outdated fairly quickly.
Advances in technology and data bases has allowed for data to be more flexible than video. Data visualizations and interactive infographics, for instance, can be up-to-date at any moment in time if they are hooked up to the right data bases. Think of charts of stock markets that updated every millisecond because APIs or other technological mechanisms feed them live data.
We wanted to combine those two worlds — the world of immersive video storyelling and that of live and constantly updated data. This is why we created Data Docs.
Through the Data Docs code library filmmakers and developers can 'hook up' their video to live data and other up-to-date information from the web. The library also allows you to integrate your own interactives with specific fonts and styles into your video. It enables you to project HTML, CSS and JavaScript-based graphics on your video. This helps you make videos that will never be out of date or, in other words, to make videos that are evergreen.
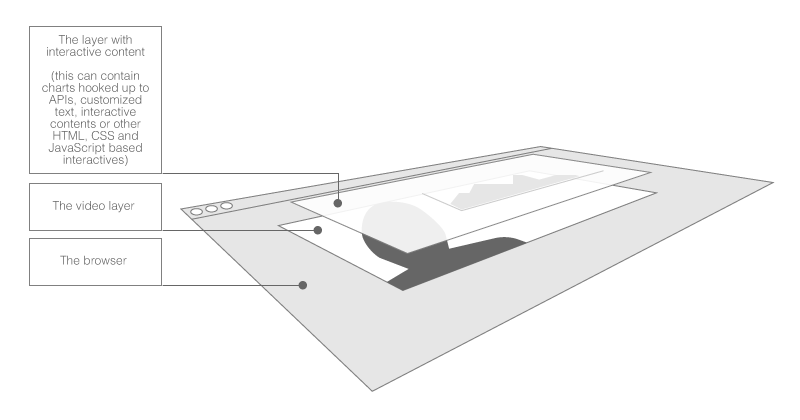
An illustration how the Data Docs platform works.
Sample story: The Jobs Report
Every first Friday of the month, newspapers across the U.S. report these two numbers: the number of jobs added to the economy in the past month and the unemployment rate. "We added 120,000 jobs last month!," a headline might proclaim. "Unemployment rate is at 7.2%!," another outlet might print. We take these kinds of headlines for granted, but they are almost meaningless without context.
What do we need to know to truly understand them? The sample data story below explains the government's jobs report to you:
For best viewing experience, please go here: http://www.datadocs.org/prototype/
The prototype displays multiple features of Data Docs.
- Customized lower thirds/chyrons: We used data docs to display expert names and their titles on top of video (time code: starting at 0:00 but used throughout the video). This allows you do make text changes on the separate from the video, allowing you to change information without having to re-export the video file.
- Customized text on screen: To keep with the look-and-feel of the animation we made an alphabet that mimicks the twitchy, black-and-white and hand-drawn of the entire piece. This allows the text that we're changing to integrate seemlessly into the video and avoids interrupting the viewer's experience of the video (see an example at time code: 0:44).
- Interactive components on your video: We drew an interactive chart on top of the video and displayed the chart when it was relevant to the story told in the video. The chart is drawn from a data feed on the web — for coders: it's drawn from an API — and is hence always up-to-date (time code: 2:23)
Below you will find step-by-step instructions that help you integrate different features into your video. If you're a filmmaker interested in using these libraries, we highly recommend you pair up with a developer.
How To Get Started
If you're new to working with code on github, the simplest way to get started is to use the "Download Zip" button at the lower right of the datadocs/datadocs repo page to download all the code to your computer. Once you've unzipped the package, you'll have all the same files and folders that you can see online.
To get a sense for what DataDocs can do, we recommend that you actually skip the main index.html file in the main folder, and instead navigate down into the examples folders. Each of these folders is named after the DataDocs feature it demonstrates, and looking at the index.html file in each of these folders will give you a good sense of what the DataDocs platform can do - from adding simple text overlays to your video all the way up to loading dynamic data and interactive charts. Though each of these examples only shows one feature in action at a time, they can, of course, all be combined into a single DataDoc and used multiple times in a single video.
Note: because of browser restrictions, it is easiest to view all examples in FireFox; the ones that load external data will not work on your desktop in Chrome (and none of them are likely to work in Internet Explorer!).
About the Examples
One thing that can be tricky at first about adapting examples from github is the file structure. You'll probably want your finished DataDoc to live on a page at something like mydomain.com/myDataDoc.html. In order to keep everything in sync on github, though, if you simply duplicate or modify a set of existing example files, they will need to live inside two sets of folders to work, just the way the example files do.
The way around this is simple: when you're ready to move your DataDoc to the web, go into your index.html and delete the ../../ from in front of any links or URLs that have them. Then, when you publish, you make sure that you add all of the files from your video to the various css/assets folders that are in the main DataDocs folder (you can also feel free to delete any videos or data files in the existing folders that your DataDoc does not use), and replace index.html and main.js with your own files. Once you've done that, you should be all set.
In each of the examples below, you can always replace the underlying video with your own by saving your video files in the assets/videoFiles folder, and then update the source links in the HTML page of whatever example you're using. Likewise, you will probably want to update the poster image link in the video tag to match the content of your video.
Note: You should make sure the poster image matches the initial size of your video, and be sure to leave its styles set to width & height 100%.
Example 1: Adding simple text
Try the "simple text" live demo
The "simple text" DataDocs example demonstrates exactly that: how to add some static text fields to your video in the webfont of your choice. The process is as follows (note that unless otherwise specified, whenever we say "open" we mean open the file in your favorite text editor - Aptana Studio 3 is free and cross-platform, Sublime Text is also great):
1. Open up dd_simple_text.html. Near the top of the file, you'll see some text that says "load our webfont" with a link on the line below. That link comes from the Google Webfonts directory, and tells our page to load, in this case, the font "PT Mono". Feel free to change this link to the webfont of your choice.
2. Scroll down the HTML code a bit until you find the overlays div. You'll notice that there are 3 other div tags inside, each with a distinct id. Inside these is the text that appears in the DataDoc. Feel free to change this text and/or the ids of the divs.
3. Open up css/dd_simple_text.css. You'll notice that there are 3 css tags, each of which corresponds to one of the divs in the original HTML file. Here you can change the color, position and font-size of your text; you can also change the font-family to match your new one if you've updated that link in the HTML file. >Note: make sure that the CSS class names match the id of your divs.
4. Open up main.js. In this file, you'll see three calls to the data_doc.addSalt each of which has a target field that matches one of the original divs. Adjust these fields to match you new div ids, if you've changed them. Next, adjust the start and end fields on each one to match when (in seconds) during the video you want your divs to appear and disappear.
5. Open dd_simple_text.html in your web browser, and see your customized DataDocs in action!
Tip: You can add as many text divs, css classes and addSalt calls as you need for your video. Just make sure all the ids are unique, and that each one has a corresponding css class and addSaltcall with the id in the target field.
Need to add a lot of text? Check out the next example for a bulk method of adding text to your Data Doc.
Example 2: Adding multiple text formats
Try the "multi-text" live demo
The multiple text formats or "multi_text" DataDocs example demonstrates how to use a specially formatted JSON file to more efficiently add lots of text overlays to a DataDoc. You can still use any webfont you like, but instead of manually adding divs, CSS classes and "addSalt" calls to your files, you edit a single JSON file where you specify all the information necessary to position and time your text.
1. Open up assets/dataFiles/text_labels.json. On line 2, you'll see a JSON element called stylesheet. This is where you can specify the font (or webfont) that should be the default for all of your text labels (don't worry, you can override these for individual pieces of text).
2. Inside the text_blocks JSON array, you'll see a series of individual elements, each of which contains 3 arrays (enclosed by square brackets []). The top_left array controls the positioning of the text div that will be created. The start_end array specifies the time, in seconds when the text will appear and disappear. The text_list array may contain one or more elements, each of which corresponds to a individual line of text in the final video. Each element must have at least a text field that contains the text to display, and may include an optional fontSize and fontFamily field, specifying the point size and font that should be applied only to that line of text, if different from the default. Note that multiline text is achieved by adding putting multiple elements into a single text_list array. Feel free to add, remove and change these elements as you like.
3. Open up dd_multi_text.html in FireFox (this example won't work in Chrome on your desktop). You should see the video with your new text fields and timing appear!
Note: If you don't want your text file to be called text_labels.json be sure to rename it while keeping the .json extension. Then in main.js, change the name of the .json file targeted in the $.get function to match your own.
Example 3: Reveal Text
The reveal_text example demonstrates how to add a "reveal" effect to data docs text, so that words or phrases in an individual text div appear in sequence rather than all at once. To review the process for adding text, changing its font and adjusting its timing in the video, refer to the instructions for the simple_text example above. Once you've got all the timing, positions and appearance set, just do the following:
1. In one of the text divs inside your dd_reveal_text.html file, add pipes (|) wherever you want there to be a delay in the text's appearance.
2. In the main.js file, make sure that each addSalt method has two added parameters: has_reveal: "true" and reveal_timeout: 300 (where 300 is the number of milliseconds' delay between text snippets revealed. The delay can be different for each piece of text, and you can mix "reveal" text with "simple" text in any combination you like within a DataDoc.
3. Open up your dd_reveal_text.html file in your browser, and check out your DataDoc!
Example 4: Launch a URL from your video
Try the live demo and click on a URL in the video
DataDocs is designed to help videos be more web native; in addition to interacting with web-based API data (see below) and supporting interactive graphics (see below), DataDocs allows you to make the content of any of the divs in your overlays container into a button that opens a URL in a new window or tab, which automatically pauses the video for the user. In the current example, text divs are added to the video in the same manner as seen in the simple text example above. Each one is then tied to a specific URL using the addCaramel function, as explained below:
1. Once you have the text customized as you'd like in your dd_launch_url.html file, open up main.js. You'll see that for each of the divs in the original HTML file, there is a call to data_doc.addCaramel that has two parameters: url and target. Adjust these values so that for each div you'd like to link to a given URL, there is a data_doc.addCaramel call that has the div id as the target and the desired URL in the corresponding url field.
2. To make it clear to the user which pieces of text are clickable, we suggest that you apply some additional CSS to text divs that open URLs. In the dd_launch_url.html, try adding one of the following classes to your linked text divs: shadow, glow or outline. You'll find these classes in the css/dd_launch_url.css file, where you can feel free to customize them to suit your video's style. We suggest choosing a single style for linked text and sticking to it throughout an individual DataDoc.
3. Open up dd_launch_url.html in FireFox or Chrome on your computer, and check out your links' styles and functionality!
Example 5: Add a JavaScript element to your video
Beyond opening a specified URL, DataDocs allows a click on an overlay element to trigger an arbitrary JavaScript function with additional parameters. For the basic setup overview, refer to the instructions above for examples/launch_url. Then adjust the files as below:
1. Open dd_execute_js.html. Towards the bottom of this file, you will find the div id="external_content" element with some placeholder text in it. This is the div that our JavaScript function will update when the policy_text overlay is clicked. The layout styles for this div can be found in dd_execute_js.css. Note that the "external_content" div is outside of the "all_info" div that we have specified as our video's fullscreen container (refer to DataDocs structural overview for more details on how the libraries organizes these divs). We have placed "external_content" outside of this because this particular content is "outside" of our main video and should not be included in fullscreen mode. >Note: Other Data Docs overlay divs can also be targeted with these functions.
2. Open main.js and navigate to the addCaramel entry with the target "policy_text". Instead of url, this instance includes two options: function_name, which is assigned the string name of the function that a click on the target div should trigger, and the optional function_params, which is a JSON object containing any other information that the JavaScript function should know about. Try changing the value of the text entry of this object.
3. At the bottom of main.js is the particular JavaScript function this example uses; is called policyClickHandler. Although we do not use it here, the actual click event will always be the first argument passed to any function triggered this way; the second argument will hold the function_params object specified in the addCaramel call (if included). In this simple example, we use the target part of the paramsObject to access our "external_content" div, and then simply set its contents to the value of the paramsObject "text" property.
4. Open up dd_execute_js.html in Firefox or Chrome on your desktop, and watch what happens when you click the "Influence Monetary Policy" text!
Example 6: Use an API
The simple api DataDocs example shows how you can use the data returned by an application programming interface (API) call in your DataDocs video. The trick here is to make sure that you create one (or more) empty div tags in your HTML file either by writing them directly into the "overlays" div as you would in the simple text example, but leave them empty. Alternatively, you can add the necessary div tags with JavaScript or jQuery, as we have in this example.
Once the empty div has been added to your "overlays" div, you will call data_doc.addSalt as usual, followed by a $.get request for the JSON file that has your data. It is then up to you to write a callback function that extracts the data you want from the JSON file and adds it to the div tag of your choice.
Note: Due to browser security restrictions, it is generally not possible to load data directly from an API into your DataDoc. In order to include data in your DataDoc that updates itself regularly, you will have to set up what is known as a "cron" job on your server. For an overview of setting up cron jobs, see the code box below.
A "cron" (as in "chronic") job is a script that lives on a web server and runs at specified intervals. It is often used to
retrieve and save copies of API data on your own domain; this lets your web pages (and DataDocs!)
load this data while avoiding cross-domain browser security restrictions and also generally prevents your
applications from being rate-limited (i.e. blocked) by your data provider for calling the API too frequently.

For specifics on how to set up a cron job on your server, you'll need to consult your web hosting
provider, both to make sure that your account supports curl scripts (a common method of retrieving data
from other domains) and on how activate and/or use them with your particular provider.

In general, you can set up a cron job by doing a variation of the following: ssh into your hosting account,
and then type "crontab -e" and hit enter. The beginning of any cron job specifies the when the script runs using
the following 5 parameters, as follows (an asterisk means run the script on every one of that interval):

    minute: 0-59
    hour: 0-23
    day of month: 1-31
    month: 1-12
    day of week: 0-7 (0 and 7 both Sunday)

So, for example, a crontab line that begins with

    0,15,30,45 12 * * *

Would run the script on that line at 12, 12:15, 12:30, & 12:45 every day of every month all year long.

After you've specified the frequency, you'll write something like
    curl /usr/bin/curl -o ~outputfilePath/outputfileName.json http://applicationProgrammingInterfaceCallHere

In the above command, "curl /usr/bin/curl" is the curl command, plus the path that our particular hosting
provider requires that we use for curl itself. the "-o" parameter specifies that the name of the output file
will be different than that of the URL being called. The "~outputfilePath/outputfileName.json" parameter specifies where the
copied data should be saved, and with what name. Finally the "http://applicationProgrammingInterfaceCallHere"
is the actual URL from which you want to copy the data.

As an example, here's an example of what one of the DataDocs prototype curl commands looks like:

    * 8,9 * * 5 /usr/bin/curl -o ~/datadocs.org/prototype/dataFiles/MonthlyJobsChanges.json http://api.stlouisfed.org/fred/series/observations?series_id=PAYEMS&observation_start=2010-10-01&units=chg&api_key=XXXXXX&file_type=json

The above command specifies that the script should run every minute in the hours of 8am and 9am on every Friday of the year,
and save as the file datadocs.org/prototype/dataFiles/MonthlyJobsChanges.json the data that copied from
http://api.stlouisfed.org/fred/series/observations?series_id=PAYEMS&observation_start=2010-10-01&units=chg&api_key=XXXXXX&file_type=json.
Note that this example won't work in your browser directly becausewe have scrubbed out our API key.
But the folks at FRED would be happy to give you your own for free!
To add API data to your DataDoc, do the following:
1. Make sure you have a copy of your desired data in your assets/dataFiles folder. Open up your main.js file and add one or more div tags to your "overlays" div via JavaScript or jQuery, duplicating and modifying the example code as necessary. Alternatively, you can simply add div tags directly inside the "overlays" div in the dd_simple_api.html file.
2. As in the simple text example, modify the data_doc.addSalt call(s) in main.js to target your specific div tags.
3. Modify the $.get function call to point to your own data file and specify the name of your callback function. It is up to you to write a callback function that pulls the necessary information from your data file and adds it to your target div using either JavaScript or jQuery.
4. Open up dd_simple_api.html on your computer in FireFox and check out your new data-driven video!
Example 7: Insert a dynamic chart
One of the features of DataDocs we're most excited about is its support for visualizations (even interactive ones!) driven by API data. In this example we show how the Google Visualizations API can be used to create customized, interactive line charts using API data, though any combination of data and visualization library can be used as long as the results are rendered inside a div.
Note: Due to the implementation details of Google Visualizations, this particular example is not properly interactive in fullscreen mode, though it works as expected at its original resolution. Over time, we hope to include to provide an index of libraries that work correctly in fullscreen mode as well.
As in the simple api example, we'll start with empty div tags and then add the visualizations to them once our libraries have loaded:
1. Open the dd_dynamic_chart.html file, and update the number/ids of the empty divs in the "overlays" div. In css/dd_dynamic_chart.css update the positioning of the divs by creating or modifying the corresponding css classes. In main.js, adjust the data_doc.addSalt calls to target your updated divs.
2. Before we can render our chart, we need to make sure the charting library has loaded. In dd_dynamic_chart.html, the Google Visualization API is loaded just below the "load the google visualization library" comment. After our data_doc.addSalt calls in main.js, we'll use the google.load method to load the corechart package and tell it to run the function loadChartData once the library is loaded (this is specified in the callback parameter).
Once the library is loaded, the function loadChartData will be called, so inside this function we'll use $.get requests to load our data files. In this example, we're looking at unemployment data from the FRED API. Each of these requests will trigger an individual function to reformat the data, customize the look and feel of the chart and build it in a specified div.
Note: For a discussion of how to use cron jobs to have the data in your JSON files update automatically from an API, see the simple api tutorial.
4. In the JSON callback function (buildU3Chart and buildU6Chart in our example), we first create a Google Visualization DataTable object, and then reformat our JSON data into an array of arrays and use Google's built-in addRows method to add it to our DataTable object. In the options JSON object, we can customize virtually everything about our chart's appearance according to the documentation here . Finally, we pass our target div tag via javascript the google.visualization.LineChart method and call the draw function with the DataTable and our options object to draw the chart.
Note: The google.visualization.LineChart function must be passed a div retrieved with plain JavaScript; a jQuery object will not work properly.
5. Open up the dd_dyanmic_chart.html file in FireFox to view your video with its included dynamic charts!